May 2025 Industrial market report
AI-Fueled Data Center Boom Faces Growing Investor Doubts
Updated on May 29, 2025 | 12 minutes read
Key Takeaways:
- National vacancy rate rose to 8.8% in April, but it is expected to stabilize in the following months, as new supply deliveries started to taper off
- National in-place industrial rents averaged $8.49 per square foot in April, up 6.7% year-over-year
- Boston and Bridgeport posted some of the nation’s widest lease spreads in April at $4.79 and $5.90 per square foot, far surpassing the national average of $1.79
- Midwestern markets posted the slowest yearly rent growth nationwide, with Memphis at 3.7%, Kansas City 3.8%, and Detroit at 3.9%
- Western markets remained resilient, with Los Angeles and Portland posting vacancy rates under 10%, despite rising supply
Trends & Industry News
Data Centers Boom but Questions Remain
Generative AI has made massive leaps in recent years, driving a demand boom for data centers. However, AI firms face an array of challenges as the nascent industry moves into the future.
Tech firms’ massive investments in AI have led to a data center surge, with more than 51 million square feet (23.6% of stock) of new data centers breaking ground since the start of 2023. The rush may be slowing, however, and in recent months, reports emerged that two tech giants are slowing data center leasing. AWS has paused some lease talks, and Microsoft is holding off on plans totaling one billion dollars across three campuses in Ohio, as part of a larger global pullback. Both firms downplayed these pauses as temporary and the result of capacity management, but this marks the first noteworthy slowdown that has occurred during the AI boom.
Some investors are beginning to question the return on investment for the sector. Last summer, Goldman Sachs made waves when it expressed skepticism about AI. In a research paper titled “Too Much Spend, Too Little Benefit”, Jim Covello, head of the firm’s global equity research, laid out the case that AI’s trillion dollars in investment over the next few years has no trillion-dollar problem to solve. Investor skepticism picked up again this year when Chinese startup DeepSeek unveiled a cheaper, less resource-intensive model than Western companies have been able to produce. Estimates place e-commerce sales as requiring about three times as much warehouse space as traditional brick-and-mortar, dollar for dollar.
Much like the rush to build distribution to support the e-commerce boom that COVID accelerated, the rightsizing mentality that soon followed is already on the minds of data center users and developers. We expect more caution in the near future, as companies determine what the right footprint should be.”
Peter Kolaczynski, Director, CommercialEdge
Beyond financial challenges, AI faces other headwinds. Data centers’ power requirements have led to site selection problems and community pushback. The phenomenon among generative AIs known as hallucinations—producing false or misleading information—could severely reduce AIs’ impact in fields like medicine, manufacturing and legal, requiring significant human oversight to avoid critical errors. Critics say hallucinations are inherent to generative AI, and analysis of recent models from OpenAI has shown higher rates of hallucinations than previous ones produced. Additionally, legal challenges around copyright, liability and discrimination pose a serious threat to the growth of the industry.
Generative AI is here to stay, and it will continue to fuel significant growth of data centers for the foreseeable future. Billions of dollars have already been poured into the technology, and the current administration has adopted a favorable stance, offering support and little-to-no regulation of the industry. However, it is not a given that demand will continue to grow at this pace over the next decade. Issues around resource usage, return on investment, model accuracy and legal challenges will determine if AI reshapes the economy as we know it or if its uses will be narrower.
Rents and Occupancy
Midwest Rents Lag Nation
National in-place rents for industrial space averaged $8.49 per square foot in April, up five cents in the month and 6.7% over the past 12 months.
The Midwest continues to be the region with the slowest industrial rent growth. While Memphis had the slowest surge of the top 25 markets covered in our report over the last twelve months, at 3.7%, the next five bottom markets were all in the Midwest—Kansas City (3.8%), Detroit (3.9%), Indianapolis (4.0%), Cincinnati (4.3%), and Chicago (4.4%). The main reason for this slow growth is geography. Ample space for new development allowed new supply to quickly deliver when demand for space was red hot, keeping vacancy rates higher than those in port markets. Demographics play a role, too, as the region has generally seen the population stagnate so far this decade.
Average Rent by Metro
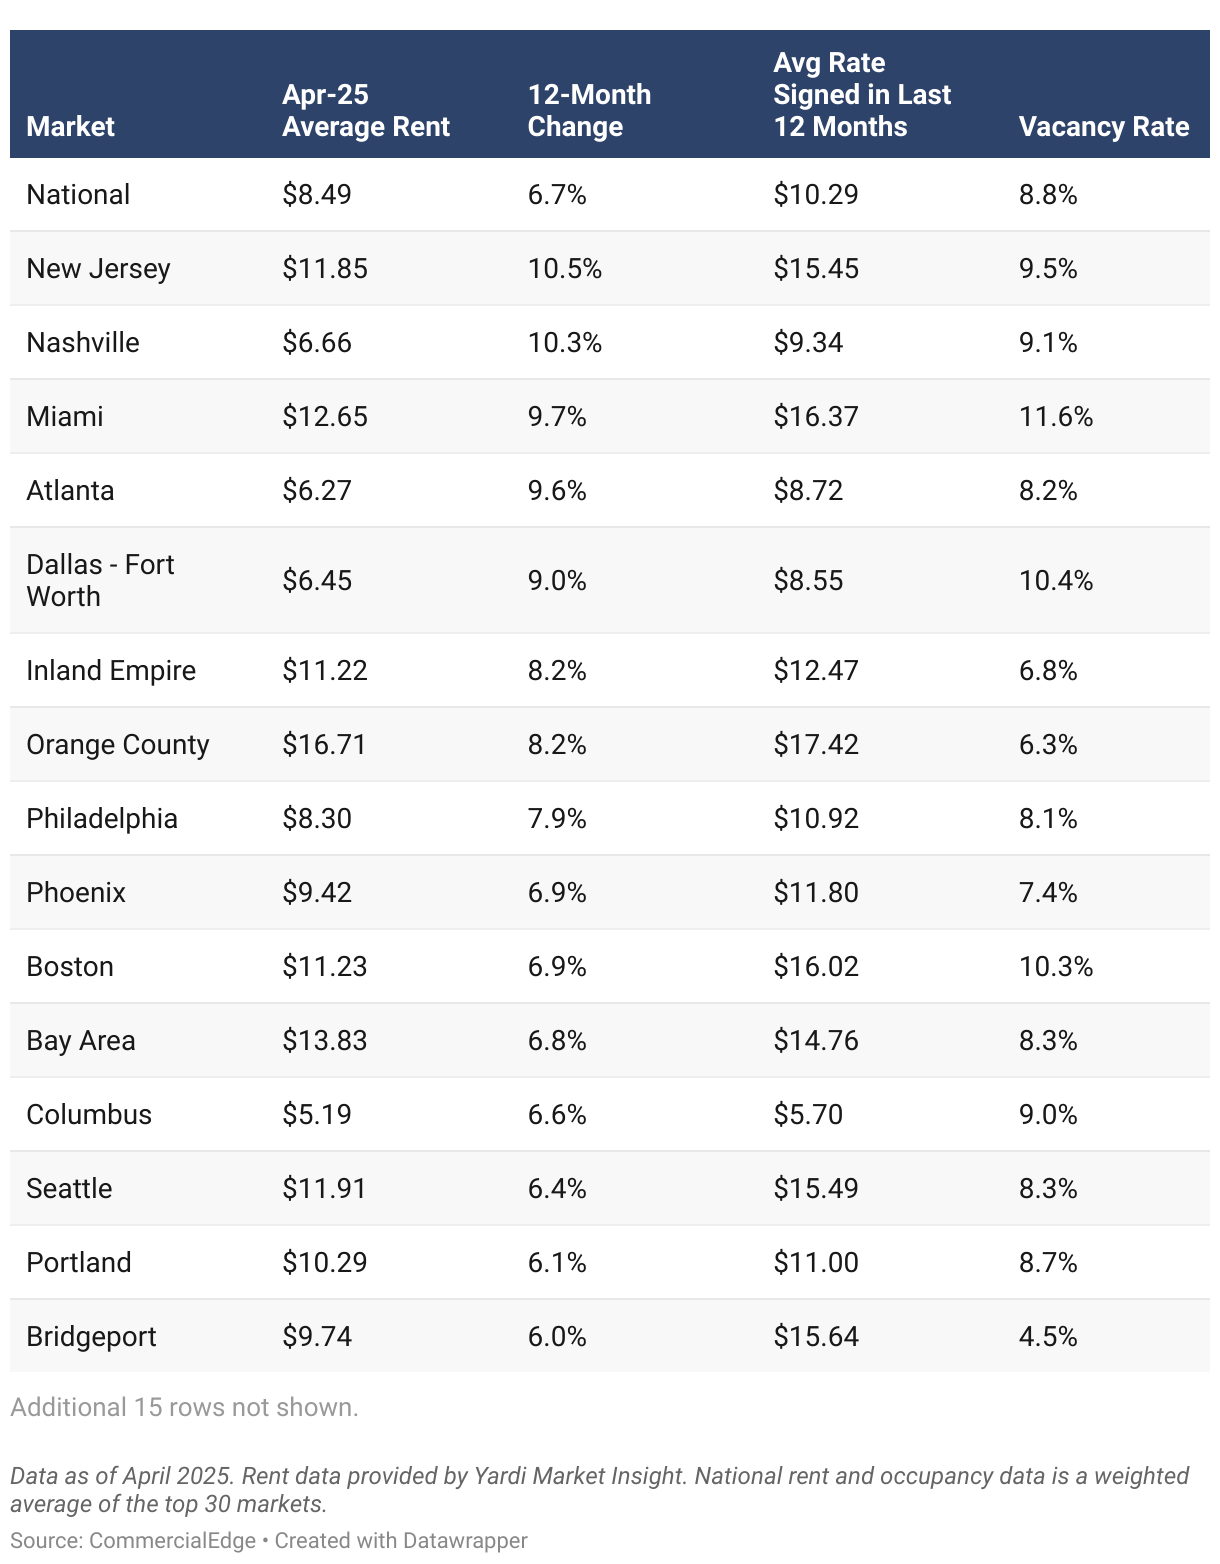
The national vacancy rate was 8.8% in April, an increase of 30 basis points from the previous month. Vacancy rates have more than doubled in the last few years. Demand began to cool at the same time that a historic level of new supply was coming to the market. With new supply deliveries starting to taper off last year, we expect that the rise in vacancy rates will not last much longer.
As vacancy rates have risen, the average premium paid for a new lease has shrunk in the last year. The national spread between a lease signed in the past 12 months and the overall in-place average rent was $1.80 per square foot. In April 2024, the spread was $2.35 per square foot.
The premium for a new lease was the highest in April in Bridgeport, where a lease signed in the last twelve months averaged $5.90 more per square foot than the market’s average rate. This spread was also high in Boston ($4.79 more per square foot), Miami ($3.72), New Jersey ($3.60), Seattle ($3.58) and Charlotte ($3.44).
Supply
Dallas Pipeline Yet to Slow
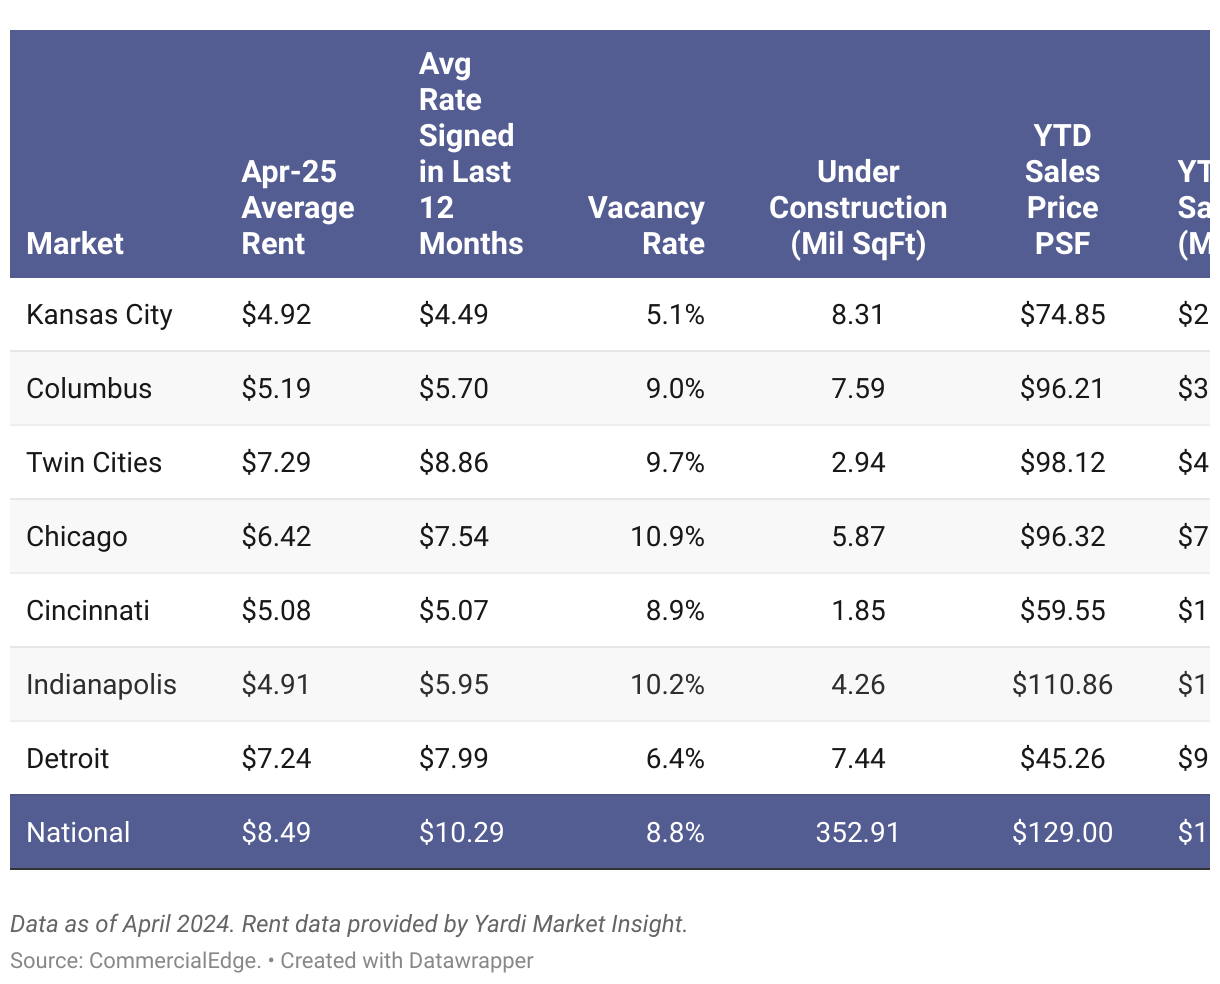
Across the U.S., 352.9 million square feet of industrial space, or 1.7% of stock, were under construction as of April, according to our U.S. industrial market report.
While most markets’ new development pipeline is slowing, that is not the case everywhere. Dallas-Fort Worth is one of a handful of markets that currently has more space under construction than it did at the same time last year. The 25.8 million square feet of new industrial space that has broken ground over the last year accounts for more than 11% of all starts nationwide.
National Industrial Supply Pipeline Trend (Million Sq. Ft.)

The recent wave of new construction in Dallas-Fort Worth is even more remarkable in the context of how much new space has been delivered in recent years. Between 2018 and 2024, more than a quarter billion square feet (26.5% of stock) have been completed in the market. The rapid industrial expansion in recent years was driven by a population boom in Texas and the nearshoring of manufacturing to Mexico. While immigration into the state is likely to continue for the foreseeable future, recent tariff uncertainty threatens slow nearshoring. Dallas-Fort Worth’s location makes it a hub for imported goods manufactured in Mexico, but many firms may enter a holding period until a new United States-Mexico-Canada Agreement (USMCA) is reached.
Transactions
Chicago Sale Prices Stall
Industrial transactions totaled $15.5 billion during the first four months of the year, according to our industrial property market report, with properties trading at an average of $129 per square foot.
Through April, Chicago has seen the third-largest sales volume in the country, totaling $790 million year-to-date. As the nation’s largest industrial market by square footage, Chicago has seen over 70 industrial transactions so far in 2025.
2025 Year-to-Date Sales (Millions)

Chicago’s industrial market remains in demand due to its central location and infrastructure, including rail and airport links crucial to national supply chains. Properties in the O’Hare submarket, along with the adjacent I-90 Golden Corridor and Itasca submarkets have consistently commanded the highest sale prices in recent years. However, price growth for the market overall remains muted, especially when compared to other large markets. While the average national sale price has increased by 62% since 2019—moving from $70 per square foot to $129 so far in 2025—the average price of an industrial property in Chicago has increased by 40% over that same time (from $69 per square foot to $96). This is largely due to the impact of new supply, with Chicago adding 125 million square feet (11.4% of stock) of new space since the start of the decade.
Western Markets
Central Valley Remains the Most Affordable Market in the Region
During April, vacancies in both Los Angeles and Portland stood just under the national benchmark, at 8.7%. However, Portland’s rate grew significantly year-over-year, by 480 basis points, underscoring ongoing challenges in stabilizing demand and absorbing newly delivered supply. Overall, most Western markets posted industrial vacancy rates below the national average of 8.8% in April, reflecting relatively resilient occupancy across the region.
Los Angeles led the nation with the highest sale price at $300 per square foot and recorded one of the largest transaction volumes nationwide at $671 million year-to-date. Phoenix also saw strong investment interest in April, topping the region with $709 million in sales. Overall, Western markets remained among the most expensive nationwide for industrial investment, with all major markets—except the Central Valley—posting sale prices above the $129 per square foot national average.
West Regional Highlights

The Central Valley also continued to be the region’s only market to stand below the national average in-place rent, with rates at $6.57 per square foot. Orange County remained the priciest market in the nation in terms of industrial rents, reaching $16.71 per square foot, following an 8.2% year-over-year increase. Meanwhile, Seattle recorded the widest lease spread in the West, at $3.58 per square foot, highlighting significant price increases in the past 12 months.
Industrial development in the West remained largely concentrated in Phoenix, which led the region with 15.4 million square feet underway in April—accounting for the highest share (10%) of under-construction and planned stock nationwide. Construction in other Western markets such as Portland (1.8 million square feet) and Orange County (1.2 million square feet) remained hindered. Meanwhile, Los Angeles saw a notable year-over-year growth in construction activity, with its pipeline expanding to 4.8 million square feet from 3 million in April 2024, signaling rising development momentum.
Midwestern Markets
Chicago Logs Third-Largest Sales Volume Nationwide
Midwestern industrial markets continued to trail the national average sale price of $129 per square foot in April, though Indianapolis edged closer to that benchmark with a notable increase to $111 per square foot from $62 a year prior. Chicago led the region in sales activity, logging $790 million year-to-date, the third-largest volume nationwide. Meanwhile, the Twin Cities also saw strong sales momentum, with $422 million in total sales—more than triple the volume recorded in April 2024.
The Midwest remained the most affordable industrial region in April, with all markets posting average asking rents below the national rate of $8.49 per square foot and seeing slower annual growth. Indianapolis and Kansas City stood out with some of the lowest in-place rents nationwide, at $4.91 and $4.92 per square foot, respectively. Lease spreads in the region were also among the narrowest in the country, starting with Cincinnati with the tightest spread nationally at just $0.01 per square foot, followed by Kansas City (-$0.43), signaling limited pricing variability in newly signed leases.
Midwest Regional Highlights
Industrial vacancy trends across the Midwest varied widely in April. Chicago posted the region’s highest vacancy rate at 10.9%, following a sharp 480-basis-point year-over-year increase. In contrast, Detroit maintained one of the lowest industrial vacancy rates nationally at 6.4%, unchanged from the previous month and reflecting steady market conditions. St. Louis remained in line with broader national trends, with a vacancy rate of 8.8%, on par with the national average.
Kansas City stood out with one of the largest pipelines nationally as a share of existing stock, at 2.8%. The market also led the region in square footage under construction, with 8.3 million square feet underway. Columbus (7.6 million square feet) and Detroit (7.4 million square feet) closely followed, highlighting strong development momentum in key Midwestern hubs. In contrast, Cincinnati continued to register one of the smallest pipelines nationwide at 1.8 million square feet, though its construction activity remained stable compared to a year ago.
Southern Markets
The South Continues to Dominate Industrial Development
Several Southern markets posted vacancy rates below the national average of 8.8% in April, with Houston recording the lowest industrial vacancy rate in the region at 6.6%, following a modest 90-basis-point increase year-over-year. Tampa (8.6%) and Atlanta (8.2%) also trailed the national rate, though Atlanta experienced a notable 360-basis-point rise from April 2024.
In April, Miami ($12.65 per square foot) was the only Southern market with average in-place rents above the national benchmark of $8.49 per square foot, following a strong 9.7% annual increase. Miami also stood out with one of the highest new lease rates nationally at $16.37 per square foot. Nashville, however, led the region in industrial rent growth with a 10.3% year-over-year surge, the second-highest nationally. In contrast, Memphis recorded the slowest annual growth nationwide at just 3.7%.
South Regional Highlights
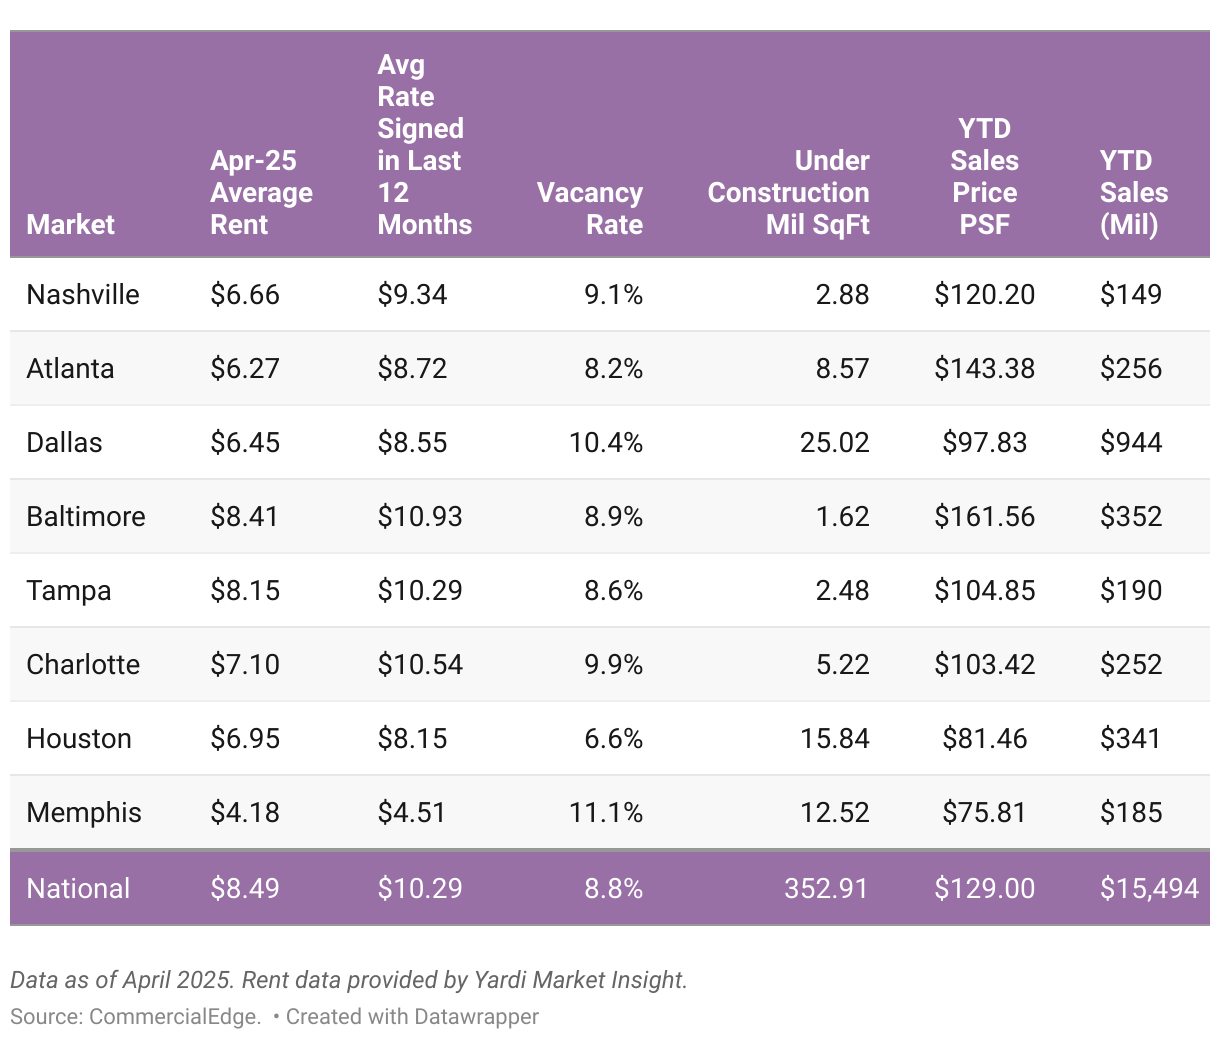
Southern markets remained largely affordable in April, with Houston and Memphis posting some of the nation’s lowest sale prices at $81 and $76 per square foot, respectively. Conversely, Baltimore ($162 per square foot) and Atlanta ($143) were the only markets in the region to exceed the national average of $129 per square foot. Meanwhile, Dallas–Fort Worth recorded the highest industrial sales volume in the South, reaching $944 million, despite a below-average price of $98 per square foot.
Regarding industrial development, Atlanta remained a key player in the region with 8.6 million square feet underway, despite a notable decline from the 11.6 million square feet recorded a year earlier. At the other end of the spectrum, Baltimore posted one of the smallest pipelines among top markets nationally—1.6 million square feet—though this marked a sharp year-over-year increase from just 790,000 square feet in April 2024. Overall, Southern markets continued to dominate industrial construction in April, with Dallas–Fort Worth (25 million square feet) and Houston (15.8) maintaining their lead in development activity.
Northeastern Markets
Bridgeport Sees Lowest Vacancy Rate in the Nation
Philadelphia led industrial construction in the Northeast in April, with 7.4 million square feet underway—holding steady compared to the same time last year. New Jersey followed closely with 6.3 million square feet in development, though the pipeline declined from the 7.5 million square feet recorded in April 2024.
Industrial vacancies across the Northeast varied in April, with Bridgeport leading the nation with the lowest rate at just 4.5%, reflecting sustained demand for space. Philadelphia also kept its vacancy rate below the national average, at 8.1%, despite a 320-basis-point year-over-year rise. In contrast, Boston continued to face space occupancy challenges, registering one of the highest industrial vacancy rates nationwide at 10.3%, after a 220-basis-point annual increase.
Northeast Regional Highlights

In April, Bridgeport stood out as the region’s most affordable market for industrial investment, with sale prices averaging just $58 per square foot. Philadelphia also stood below the national average of $129 per square foot, at $90 per square foot. In contrast, Boston ($158) and New Jersey ($281) both surpassed the national benchmark, with New Jersey ranking as the third-most expensive market in the U.S. Despite starting the year in seventh place in terms of sales volume, New Jersey continued to lead the nation in total industrial sales for the second month in a row, exceeding $1 billion year-to-date.
Northeastern markets remained among the priciest in April, with Philadelphia ($8.30 per square foot) as the only market in the region with average asking rents below the national rate of $8.49 per square foot. New Jersey led the region with asking rents averaging $11.85 per square foot, following a 10.5% year-over-year increase, the strongest nationwide. Boston and Bridgeport recorded some of the widest lease spreads in the nation, at $4.79 and $5.90 per square foot, respectively, highlighting a significant gap between in-place and newly signed lease rates.
Economic Indicators
E-commerce Sales Growth Disappears in First Quarter
E-commerce sales totaled $300.2 billion in the first quarter of 2025, virtually unchanged from the fourth quarter of 2024, according to the U.S. Census Bureau. This was the worst quarterly growth for online sales since the third quarter of 2021, which was the only quarter on record where e-commerce sales declined. On a year-over-year basis, e-commerce sales volume increased 6.1% in the quarter, which is the third lowest mark of the past 15 years.
E-Commerce Sales Volume

E-commerce’s share of core retail sales also slipped in the month, falling to 19%, a decline of 20 basis points from the previous quarter. This is the first time since 2022 that this share decreased, and only the fifth quarter on record when it has done so. All previous quarters where this share decreased were between 2020 through 2022, during a period of rebalancing after the pandemic-driven spike in online sales. While the first quarter numbers are unexpected and unwelcome for the industrial sector, long e-commerce drivers remain strong.
Download the report
Download the complete May 2025 report for a full picture of how U.S. industrial markets evolved in April, including insights on industry indicators and economic recovery fundamentals.

You can also see our previous industrial reports.
Methodology
The monthly CommercialEdge national industrial real estate report considers data recorded throughout the course of 12 months and tracks top U.S. industrial markets with a focus on average rents; vacancies (including subleases but excluding owner-occupied properties); deals closed; pipeline yield; forecasts; and the economic indicators most relevant to the performance of the industrial sector.
Get access to over 13M commercial property records with regularly verified commercial data, including local market insights, recent transactions and loan details with CommercialEdge Research.
CommercialEdge collects listing rate and occupancy data using proprietary methods.
- Average Rents —Provided by Yardi Market Expert, a cutting-edge service that uses anonymized and aggregated data from other Yardi platforms to provide the most accurate rental and expense information available.
- Vacancy — The total square feet vacant in a market, including subleases, divided by the total square feet of industrial space in that market. Owner-occupied buildings are not included in vacancy calculations.
Stage of the supply pipeline:
- Planned — Buildings that are currently in the process of acquiring zoning approval and permits but have not yet begun construction.
- Under Construction — Buildings for which construction and excavation has begun.
Sales volume and price-per-square-foot calculations for portfolio transactions or those with unpublished dollar values are estimated using sales comps based on similar sales in the market and submarket, use type, location and asset ratings, sale date and property size.
Year-to-date metrics and data include the time period between January 1 of the current year through the month prior to publishing the report.
Market boundaries in the CommercialEdge industrial report coincide with the ones defined by the CommercialEdge Markets Map and may differ from regional boundaries defined by other sources.
Fair Use and Redistribution
We encourage you and freely grant you permission to reuse, host, or repost the research, graphics, and images presented in this article. When doing so, we ask that you credit our research by linking to CommercialEdge.com or this page so that your readers can learn more about this project, the research behind it and its methodology. For more in-depth, customized data, please contact us at [email protected].
Stay current with the latest market reports and CRE news:
Posted in: Industrial, Market Reports
Released on: May 29, 2025