Key Takeaways:
- Average office lease rates nationwide increased 1.4% year-over-year
- Office vacancy continues a steady climb, partly due to new stock
- High-end office assets in top markets sustained investor confidence for $10.5 billion in total quarterly sales
- 163 million square feet of new office space is under construction nationwide, 70% located in central and urban markets
U.S. Office Space Listing Rates Inch Up 1.4% Y-o-Y, Approach $40/Sq. Ft Mark
Marking a 1.4% increase year-over-year (Y-o-Y), national office rents rested at $38.67 per square foot in March. On average, the full-service equivalent listing rates for office buildings equal to or larger than 50,000 square feet were $0.36 higher than the previous month.
Looking at individual markets, Manhattan office space was the priciest in the nation, with an average listing rate of $85.82 per square foot. Across the country, San Francisco was home to the second-priciest inventory, as office space here averaged a lease rate of $69.66 per square foot. Not far behind, the Bay Area recorded the third-highest average full-service equivalent listing rate across the markets we analyzed — $57.11 per square foot.
However, Bay Area office space came in first in terms of year-over-year growth, with the lease rate last month marking an 8.6% increase compared to March 2020. The second-largest increase was recorded in the Washington, D.C. office market, where average lease rates in March were 6.4% higher year-over-year. New Jersey office space ranked third, with average listing rates seeing a 3.9% increase over the previous 12 months.
As expected, last year’s effect on the economy at large also triggered corrective changes across several markets. For instance, Chicago office space marked a 4.5% Y-o-Y drop in lease rates, which rested at $27.59 per square foot last month. Similarly, full-service equivalent listing rates in Seattle were 3% lower than March 2020.
1 Year Into Pandemic, Office Vacancy Rates Continue to Climb
National office vacancy rates last month marked a year-over-year increase of 280 basis points, reaching an overall average of 15.6% across the major markets we surveyed for our latest report. Even so, it’s worth noting that the large-scale shift to remote work is only a contributing factor.
Rather, as mentioned in previous reports, a significant portion of new office space was already under construction prior to the onset of the pandemic in early 2020. Therefore, it comes as no surprise that competitive office markets — such as Seattle, Austin, San Francisco and the Bay Area — have seen their vacancy rates increase from single- to double-digits during the last 12 months as projects encompassing millions of new square feet of office space were being delivered.
Meanwhile, Manhattan office space boasted the highest occupancy in March, with the market recording a vacancy rate of 10.7%. The second-tightest office market in the U.S. last month was Boston, where vacancy hit 12%, marking a year-over-year increase of 240 basis points.
Investor Appetite for High-Quality Office Assets Remains High

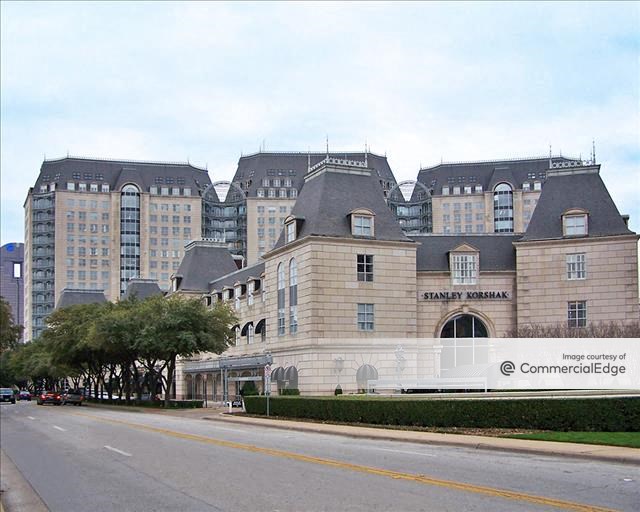
Although fewer sales closed during Q1 than in previous years, certain sales carried significant weight in the U.S. office market’s quarterly sales volume. Specifically, the sales of The Exchange on 16th in San Francisco ($1 billion); 410 10th Ave. in Manhattan ($733 million); and the recently renovated The Crescent in Dallas ($700 million) accounted for nearly 25% of the total $10.5 billion in sales that was amassed during the first three months of the year.
And, while this is roughly half of the $20 billion in U.S. office transactions that CommercialEdge data shows for Q1 2020, the deals closed so far this year indicate that high-quality office properties in well-established markets continue to attract significant investment.
14 MSF Delivered in Q1; 70% of Ongoing Construction in Urban Markets
Developers have completed 13.7 million square feet of new office space since the beginning of the year, with forecasted deliveries of nearly 64 million square feet due before year-end. Notably, data on all ongoing office construction across the markets we surveyed — including all future completion estimates — show that most of the 162.6 million square feet of new office space currently in development is in higher-density areas. Specifically, 70% of new stock in development is located in central business districts and urban markets. This is contrary to earlier pandemic speculations regarding a predicted outflow of development to suburban areas.
Download the full April 2021 report to see a detailed picture of how U.S. office markets fared in Q1, as well as insights on industry and economic recovery fundamentals.

For an even deeper dive into office fundamentals, supply forecasts and the overall impact of the pandemic, join CommercialEdge Senior Research Manager, Peter Kolaczynski, and Yardi Matrix Vice President, Jeff Adler, at the Industrial & Office National Outlook Webinar at 10 a.m. PT on Thursday, May 13.
Methodology
The monthly CommercialEdge national office report covers office buildings of 50,000 square feet or larger. Sales calculations do not always include portfolio transactions or exchanges with unpublished dollar values. Listing rates are full-service or “full-service equivalent” rates for spaces available as of the reporting period. Download the full report using the prompt above for detailed methodology.
Stay current with the latest market reports and CRE news
Latest Posts
Recent Reports
AI-Fueled Data Center Boom Faces Growing Investor Doubts
Generative AI has made massive leaps in recent years, driving a demand boom for data centers. However, AI firms face an array of challenges.
CBD Office Markets Struggle Amid High Vacancies, Discounted Sales and Slowed Development
Central business districts continue to struggle as declining listing rates and high vacancy levels persist.
E-Commerce Growth Fuels Demand for Industrial Space
While tariff uncertainty may create instability for the industrial sector in the near term, e-commerce will continue to drive industrial demand growth.


