
6 Ways Real Estate Maps Can Reveal Trends, Opportunities and Risks

Geographic data plays a pivotal role in commercial real estate, offering valuable insights that drive decision-making processes. Tools such as real estate maps enable professionals to visualize spatial information in a meaningful way. Maps can reveal patterns, trends and opportunities that are harder to grasp through traditional data sets.
How to Use Real Estate Maps for Strategic Investment and Portfolio Management
Real estate maps can be used in portfolio management, market research and analysis, site selection and risk assessment, among others, helping industry players make more informed investment decisions.
1. Visualizing Real Estate Property Portfolios
Portfolio maps combine property data and geographic information to create detailed visualizations that show properties’ location, characteristics and performance metrics. These maps enable investors to understand their regional exposure more clearly and manage their portfolios strategically.
Investors can map their portfolios by asset and/or investment type, with overlaying performance metrics, such as vacancy rates, lease prices and property valuation changes. With a clear visual representation, investors can quickly assess which assets are underperforming or outperforming, guiding strategic decisions.
Real estate portfolio maps can also provide a quick overview of properties with expiring leases or upcoming loans, allowing for proactive management strategies. Additionally, by incorporating market trends, demographic shifts and other economic indicators, maps can provide a macroeconomic context, helping investors align their strategy with broader trends in a specific market.
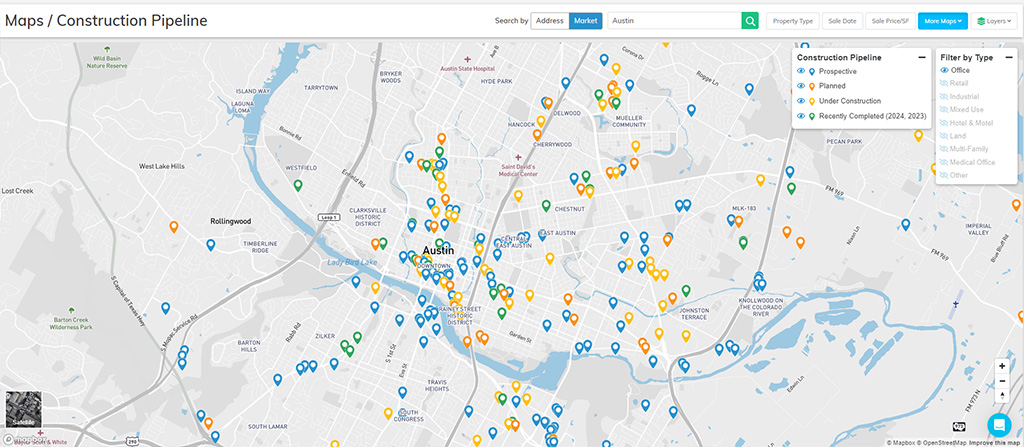
2. Monitoring Construction Pipelines
Real estate professionals can use maps to track construction trends in specific areas or niche markets. By analyzing these trends, they can forecast market growth and spot investment opportunities. This insight provides a competitive advantage, allowing them to align their strategies with market dynamics and potential growth areas.
Real estate construction maps can help predict the next hot market, allowing investors and developers to seize opportunities and capitalize on growing property values. On the other hand, maps visualizing construction pipelines can also help developers and investors identify underserved markets, revealing potential areas for expansion and portfolio diversification.
3. Conducting Comparative Market Analysis
A comparative market analysis is crucial in helping sellers set listing prices and helping buyers make competitive offers. When conducting a comparative analysis, real estate brokers can streamline the process of comparing multiple properties or markets by using maps and consolidating essential data in one accessible format, thus reducing the time and effort needed for the analysis.
Maps allow a nuanced examination of comparables by layering multiple data points, from the property’s location to its size, age and condition, as well as their proximity to amenities and key infrastructure like highways, public transit, airports and logistic hubs.
Utilizing maps in comparative market analysis can also facilitate competitor analysis by visually representing their location. This can be particularly useful in sectors like retail or coworking. Understanding where competitors are located can help businesses identify oversaturated or underserved areas. With comprehensive insights gathered through maps, real estate professionals can make more informed decisions about where to invest, what property types to focus on, and how to better position their properties in the market.
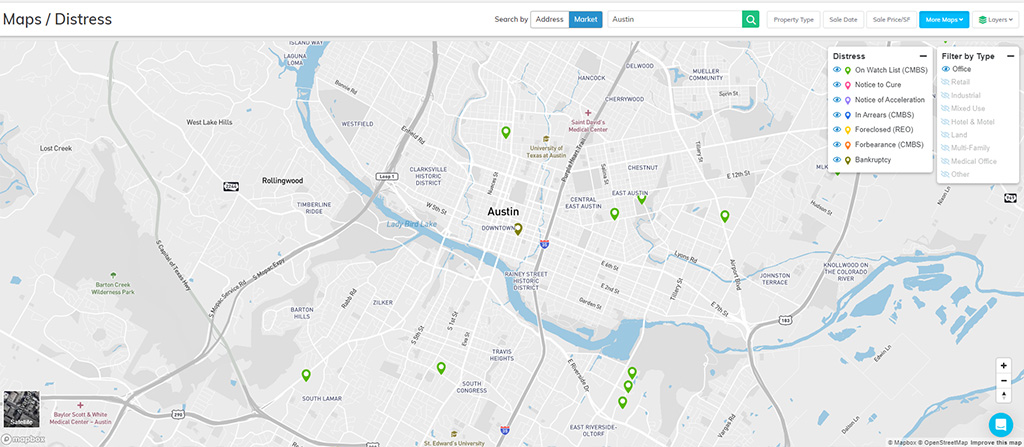
4. Identifying Distressed Properties
Distressed properties are assets facing financial or legal issues, which often lead to sales at below-market prices. These properties offer lucrative opportunities for investors interested in getting involved with commercial real estate or diversifying their portfolios.
By mapping distressed properties, investors can identify potential investments and gain insights into market dynamics. This helps them steer clear of risky areas and focus on markets with growth potential. For instance, a concentration of distressed properties in a particular area might indicate broader market challenges. In contrast, a few distressed properties could suggest that the issues are specific to individual properties.
Having up-to-date geographic data on distressed properties gives investors a competitive edge in quickly locating and assessing potential investments before they become widely known.
5. Assessing Environmental Risks
Real estate professionals can leverage maps to identify areas prone to environmental risks, including flooding, earthquakes, wildfires or industrial pollution. Maps indicating the environmental risks of a property are essential in understanding how property values might be impacted, as well as for setting insurance premiums. Properties in high-risk areas may face higher insurance costs while having a lower long-term investment value, affecting the overall return on investment.
For developers, flood zone maps and other environmental risk maps can be helpful in understanding where to build, what materials to use, and how to design structures to withstand environmental challenges.
6. Finding Investments in Opportunity Zones
Opportunity Zones represent communities facing economic distress and in need of investment and revitalization. Under certain conditions, investments in these areas are eligible for tax benefits or federal grants and programs. There are 8,764 Opportunity Zones in the U.S., with most experiencing little to no investments for decades.
The U.S. Department of Housing and Urban Development has created an interactive map showing the regions designated as Opportunity Zones. Investors can use this resource to identify the geographic boundaries of these zones and then cross-reference the information with real estate listings to find available properties.
How CommercialEdge Research Maps Help
Access to real estate maps ensures a bird’s eye view of markets and portfolios, allowing professionals to optimize asset allocation, manage risks, do their due diligence and identify investment opportunities. CommercialEdge Research, part of the CommercialEdge revenue solution suite, is a comprehensive property database powered by Yardi market intelligence.
The platform offers detailed property information and performance metrics, which users can view on maps. CommercialEdge Research maps enable users to search by property address, revealing key details like size, age, location and class, as well as sale price, lease rates and available spaces in the building. When searching for a specific property, users can explore its surroundings, including nearby amenities like retail stores or hotels.
Moreover, the platform allows users to search maps by market and filter by property type, allowing them to overlay information such as sale price, date, available listings, property and location class, construction pipeline or distressed properties. Additionally, CommercialEdge Research maps feature FEMA flood zones, highlighting areas prone to flooding.
By analyzing CommercialEdge real estate maps, investors can spot emerging markets or neighborhoods experiencing revitalization or distress, presenting opportunities for acquisition or development before they become widely recognized.


Evelyn is a creative writer covering commercial real estate trends and insights in the U.S. Evelyn was previously a senior associate editor at Multi-Housing News and Commercial Property Executive. She has an academic background in Journalism and Irish Studies. Evelyn has been covering the CRE industry since 2017. Reach her via email.
More Articles You Might Like

Anticipated Office Distress to Materialize in 2025
The wave of distress anticipated since the peak of the pandemic has begun to materialize at the beginning of 2025.

What’s New in CommercialEdge This Quarter
The latest product updates focus on enhanced leasing and commission workflows, greater customization and more seamless platform integration.

Tariff Uncertainty Brings Short-Term Disruptions to Industrial Sector
Tariff uncertainty will lead to delayed leasing decisions from industrial occupiers, while also increasing construction costs